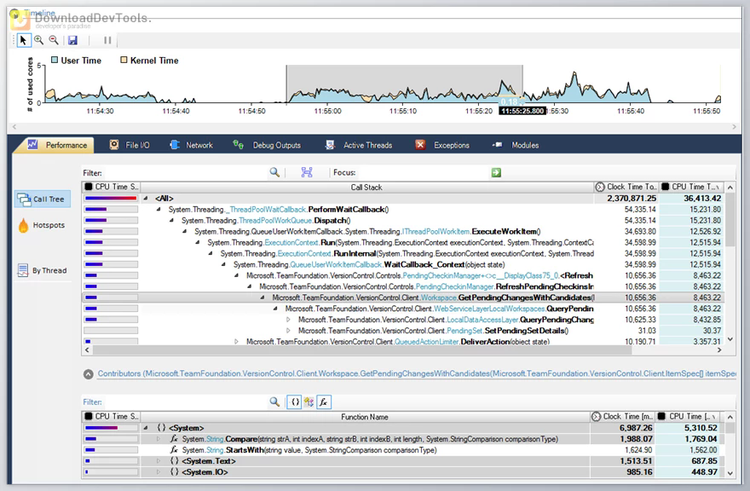
Perfinity dotNET Runtime Analyzer is a powerful .NET profiler, designed to debug and analyze performance issues within applications. Its line-level sampling profiler enables precise pinpointing of performance bottlenecks, even within native code. The tool supports event tracing, capturing file I/O and network activity, and providing valuable insights correlated with the timeline. Users can also add data context information to investigate app internals efficiently.
With an integrated .NET memory profiler, empowers users to identify memory and resource leaks effectively. Its fast allocation stack recording and minimal overhead make it stand out from traditional .NET memory profilers. The tool offers comprehensive memory issue resolution, including memory overview, tracking of issues from native code, and GDI resource tracking.
Furthermore, the application event tracker captures system and application event topics, providing timestamps and thread stack information. It offers network and file I/O activity tracing, startup performance optimization, and threading usage analysis. Perfinity dotNET Runtime Analyzer is an indispensable tool for optimizing .NET application performance and ensuring smooth operation.
