AG Chart Enterprise is the go-to choice for developers crafting enterprise applications, offering an unmatched JavaScript charting library. Developed by AG Grid creators, this high-performance tool enables the effortless creation of interactive, animated charts supporting over 20 types. Compatible with JavaScript, React, Angular, and Vue, AG Charts is a versatile, open-source solution for robust data visualization.
Emerging in 2019 within AG Grid, AG Chart Enterprise has evolved into a standalone, free, open-source library with over 300,000 monthly NPM downloads. AG Charts Enterprise enhances the library with 13 additional series types, expanding visualization options for developers.
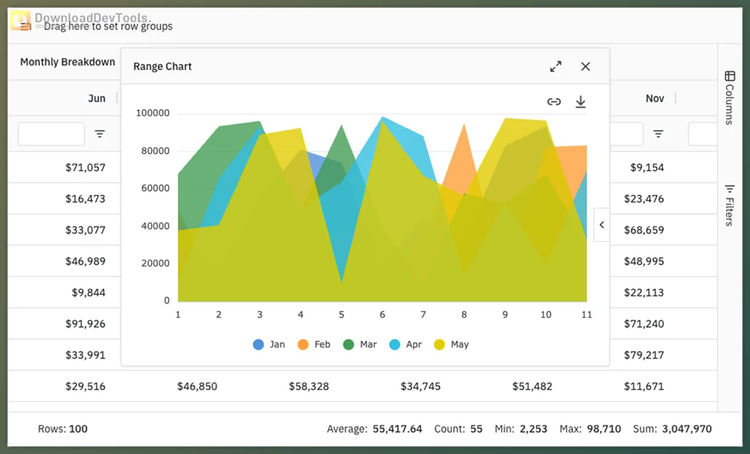
maintains the same performance and reliability standards as AG Grid, earning trust among grid developers. AG Charts Enterprise introduces features like animated graph loading, context menus, crosshairs, zoom capabilities, error bars, and background images, providing a comprehensive solution for top-notch data visualization.
